Projects / Column monitor
Case study Prototype
Stabilizer column monitor
A 3D digital twin of a 20-tray offshore condensate stabilizer. It replays 16 months of historian data through a tray-hydraulics model calibrated to the vendor's rating, finds the real bottleneck, tests optimisation moves and trains operators on upsets.
Problem
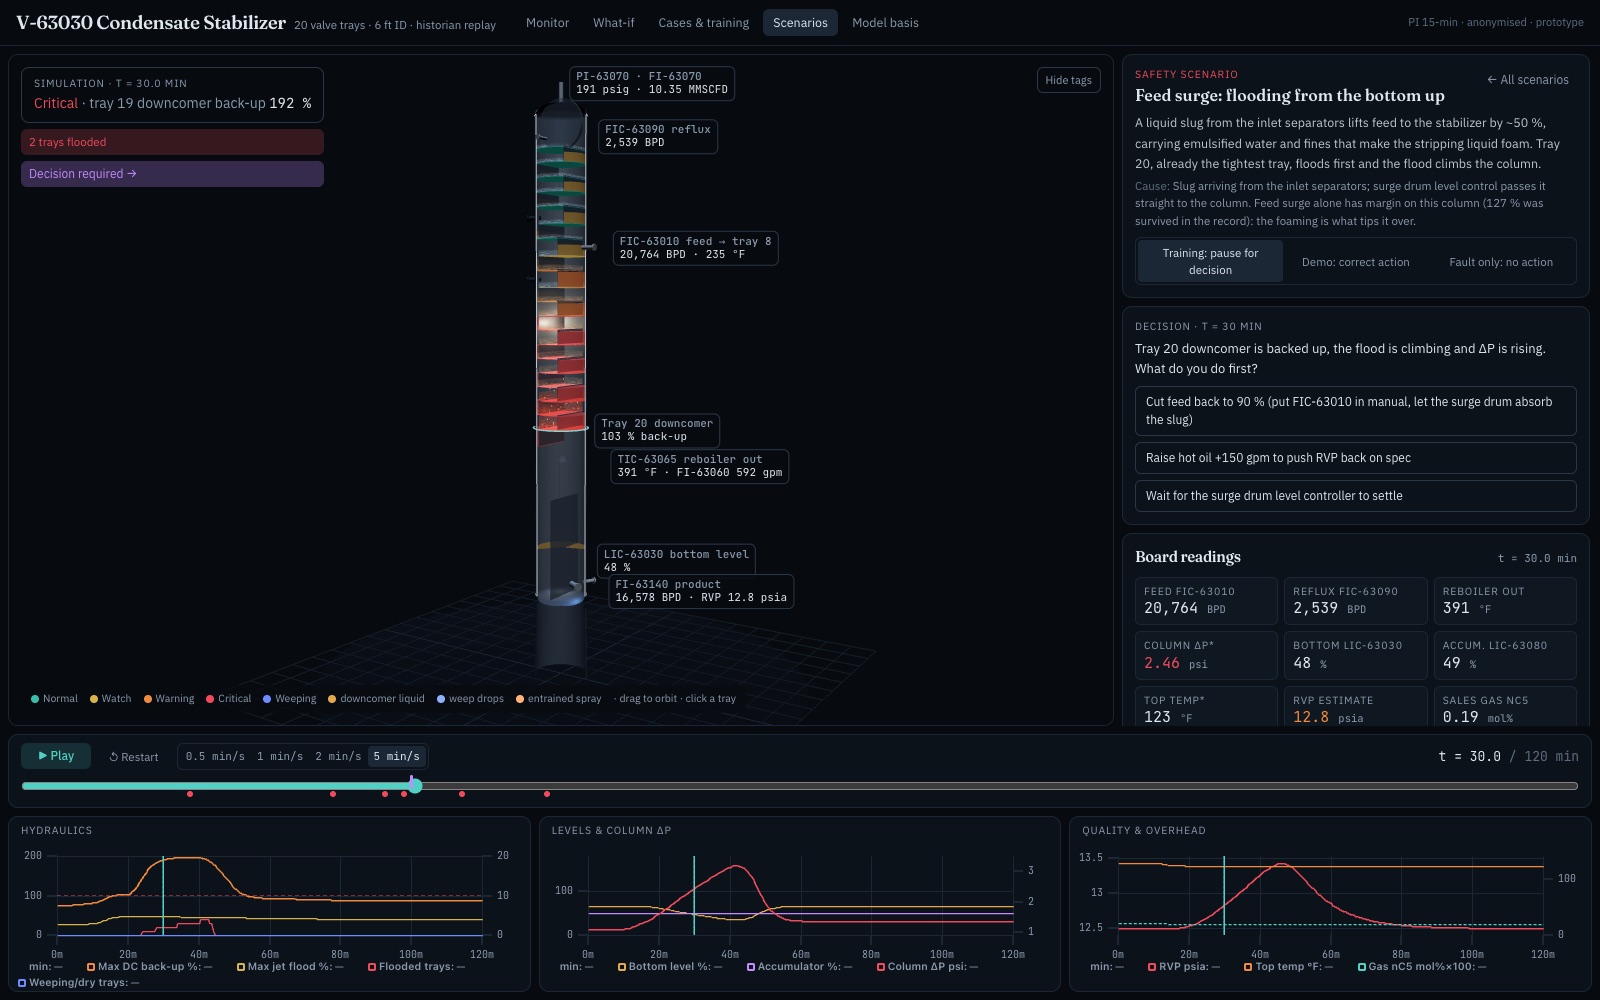
The stabilizer sets the vapour pressure (RVP) of the exported condensate. In the historian record, the product sat above its 12 psia limit most of the time. Operators had no view of how close the trays were to flooding or weeping, and no safe way to rehearse upsets. The column has no differential-pressure transmitter, so flooding would only show up late, as off-spec product or level swings.
What I built
- Monitor: a 3D cutaway of all 20 trays, coloured by status, with froth height and downcomer back-up drawn from the model. It is linked to a replay timeline, trends and an operating-window chart for each tray.
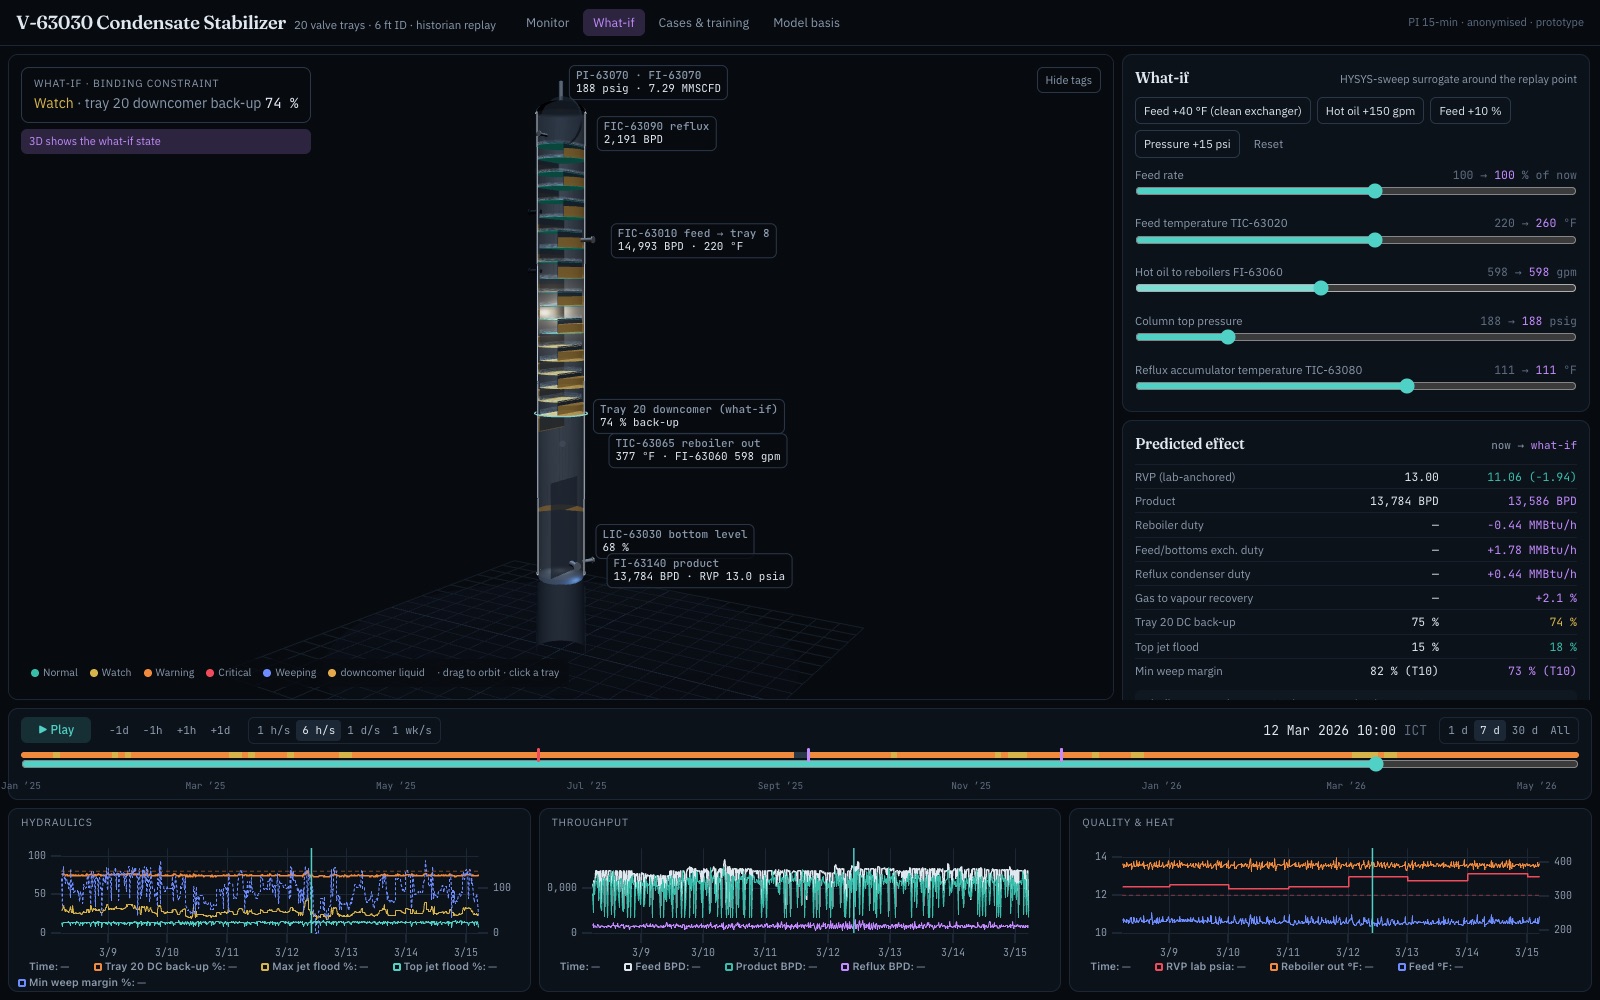
- What-if: sliders for feed rate, feed temperature, reboiler heat, column pressure and reflux temperature, driven by HYSYS sensitivity sweeps and anchored to the latest lab RVP.
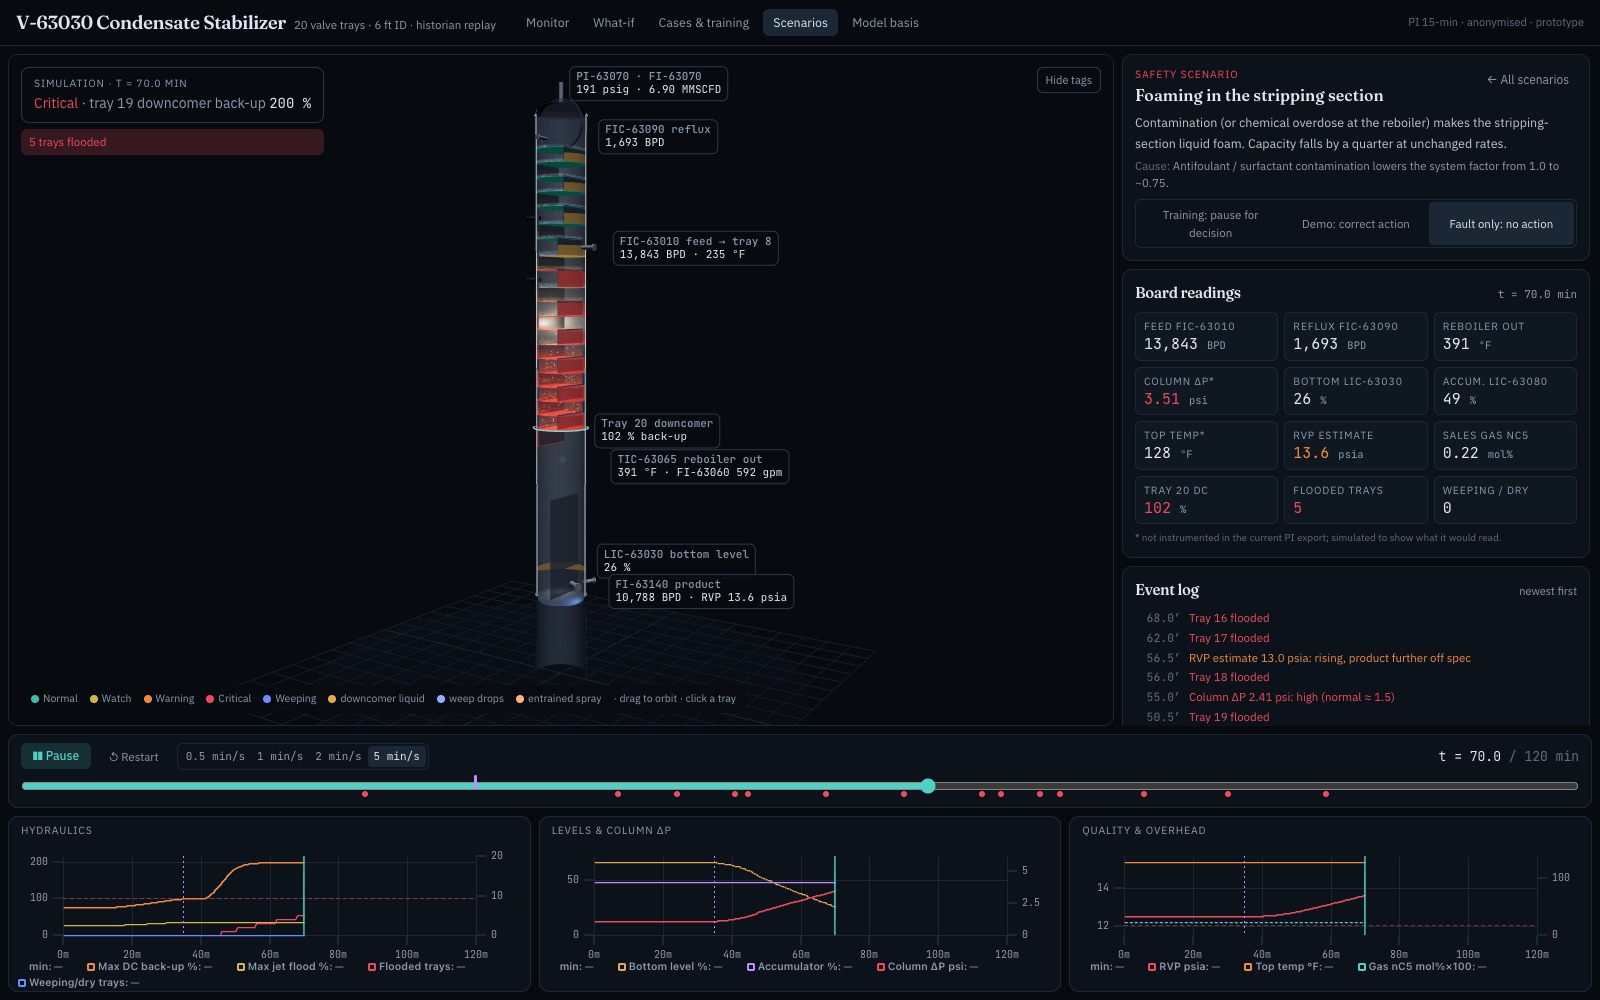
- Scenarios: eight simulated upsets with 3D animation and a decision point: feed surge, foaming, turndown weeping, loss of reboiler heat, high and low reflux, high bottom level, and cold feed.
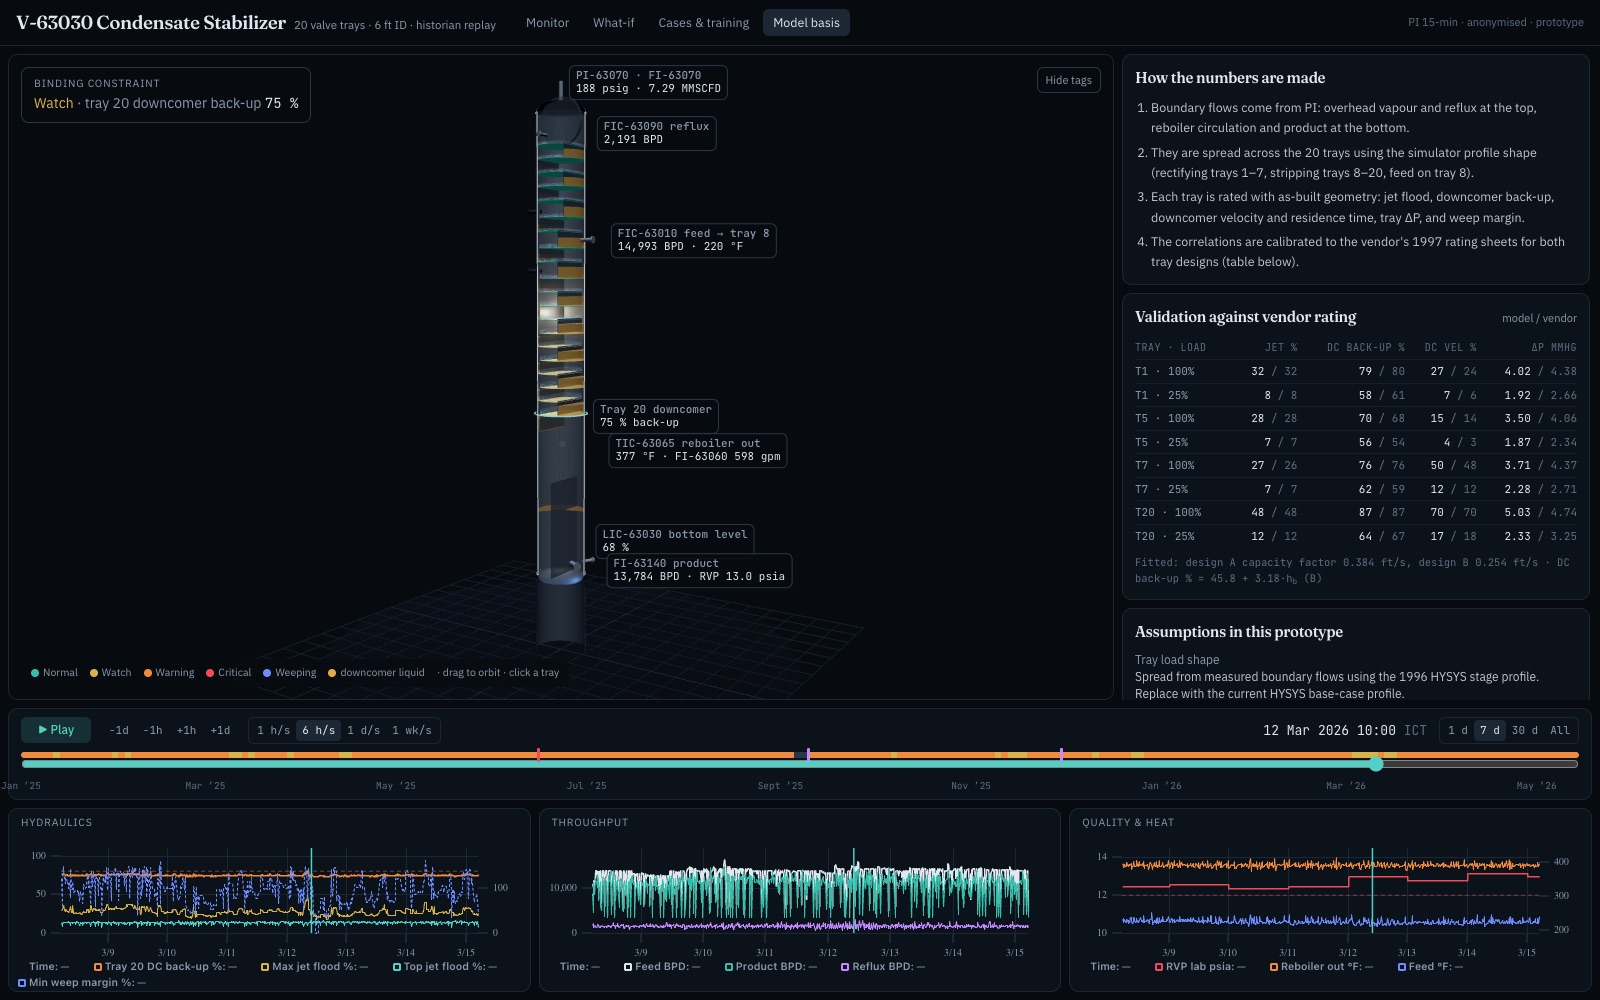
- Model basis: every assumption listed, with the vendor validation table shown openly.
How it works
Historian16 months of 15-min data, anonymised, timestamps in UTC
Boundary loadsOverhead vapour, reflux, reboiler circulation and product, measured
Tray loadsSpread over 20 trays with the simulator profile shape
RatingJet flood, downcomer back-up, velocity and residence time, ΔP, weep margin
DecisionsAlarms, operating window, what-if and training
What it shows
- The bottom tray's downcomer sets the capacity. In every running interval of the record, tray 20 is the tightest, at around 76 % back-up against an 80 % design limit. The top trays sit below 20 % jet flood.
- Feed temperature is the strongest lever on RVP. Feed arrives about 40 °F below its optimum because the exchangers are fouled. Restoring it lowers RVP without adding stripping-section load. Pushing the reboiler instead loads the binding tray.
- Flooding climbs from the bottom. The training simulator shows the signature: a column ΔP rise and a falling bottom level, minutes before RVP moves. That makes the case for a ΔP transmitter.
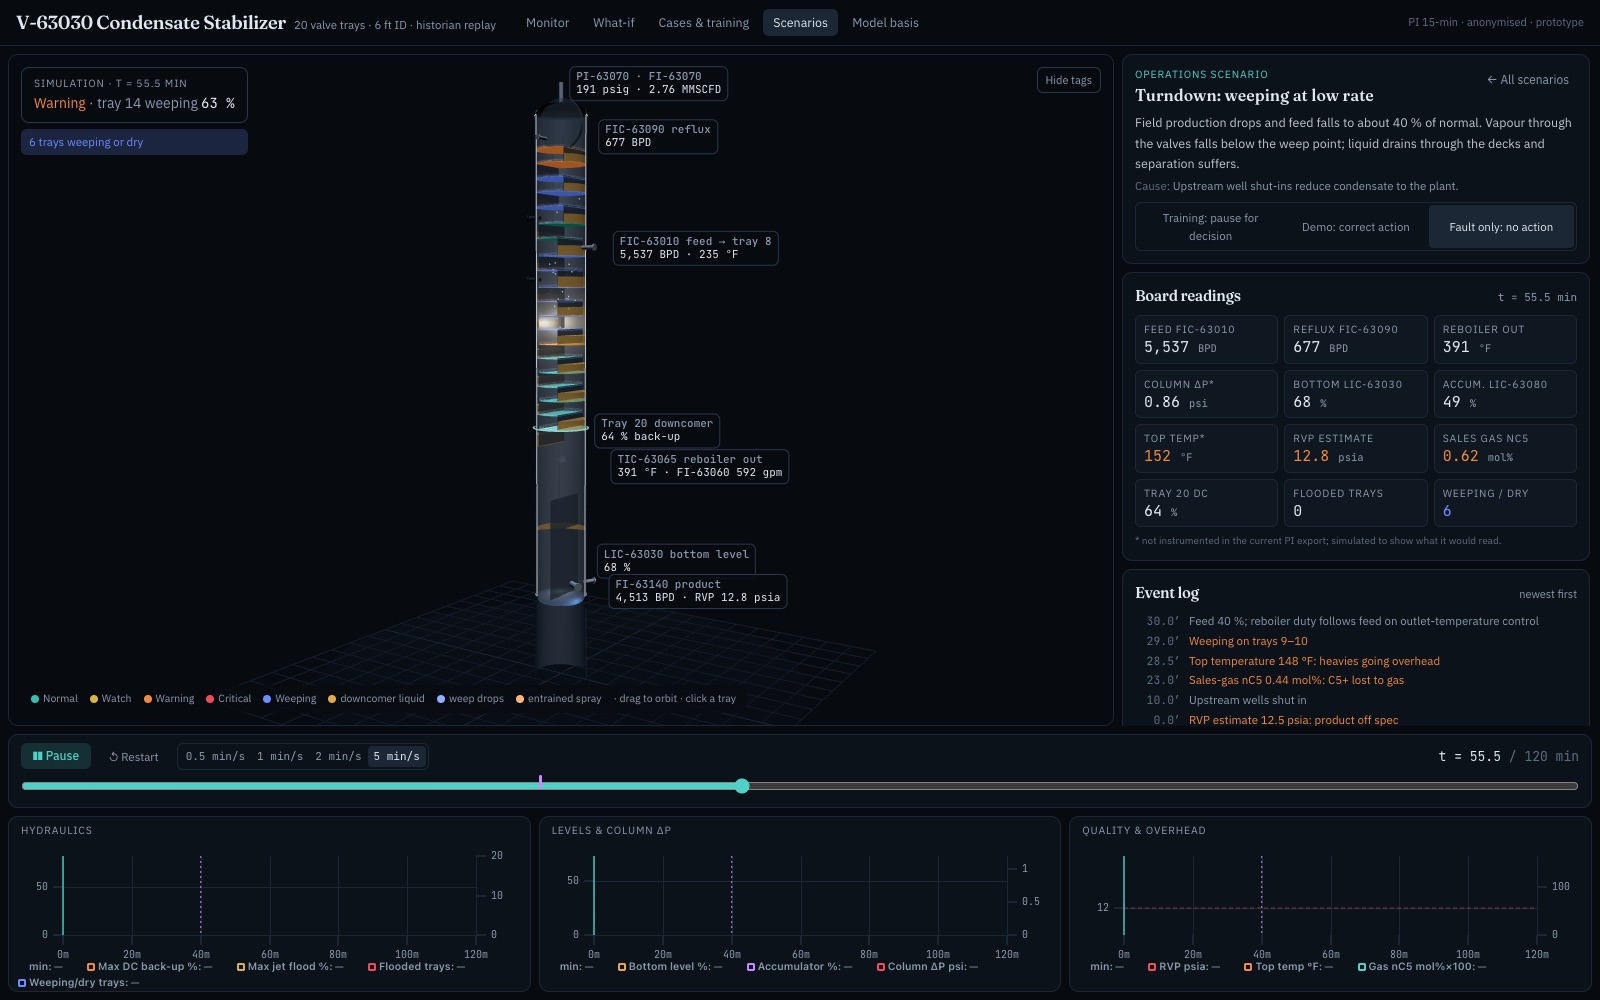
Two more scenario views: turndown weeping and stripping-section foaming.
Built with
Python · pandasTypeScriptReactthree.js / react-three-fiberuPlotVitest (31 tests)Cloudflare Workers
Limits & next steps
- The tray-load shape comes from the design-case simulation. The next step is the current HYSYS base case, column temperatures and a ΔP measurement.
- Reboiler vapour is estimated from a sump mass balance and flagged as low-confidence during transients.
- Scenario dynamics are teaching approximations on top of the calibrated hydraulics, not an operator training simulator.
- Tag numbers are proxies and plant names are removed.